Housing’s “Two-Board Knot” Problem

I was down in Washington yesterday and was pleased to be able to record a podcast on housing with Salim Furth, an economist at the Mercatus Center. We discussed his American Affairs article from last year The Two-Board Knot: Zoning, Schools, and Inequality. He describes the way that zoning boards and school boards intersect to promote inequality in America. If the podcast doesn’t display for you, click over to listen on Soundcloud. (Note: this podcast contains some audio imperfections).

Subscribe to podcast via iTunes | Soundcloud.

from Aaron M. Renn
http://www.urbanophile.com/2018/05/31/housings-two-board-knot-problem/

6 Forces Disrupting Higher Education

Universities and health care, “eds and meds”, have been in a huge growth cycle over the last few decades. Many communities have been pinning their hopes on anchor institutions like a university or research hospital to retool their economies for the 21st century.

Yet the higher education industry is facing a convergence of several trends and forces that are threaten their future. At a minimum, schools need to be figuring out how to navigate these choppy waters ahead.

Here are six forces converging on colleges today and in the near future:

1. The number of college students will soon plunge. Professor Nathan Grawe, in his book Demographics and the Demand for Higher Education, built a model that projects the future demand for college. He found that starting in 2025, the number of college bound students is likely to decline substantially.

Figure 6.1 from Grawe’s book

The elite top 50 will continue to experience robust demand, but others won’t be so luck. As Grawe told the Chronicle of Higher Education:

The bottom line is there’s almost nothing that’s going to get us around the fact that, in the late 2020s, we should see really significant reductions in enrollment. If your strategy for this is to try to increase enrollments, the model suggests that that’s a bad idea.

Grawe has provided a large amount of grim data on his web site.

2. Tuition is soaring at rates far higher than inflation. This chart from Carpe Diem and AEI says it all. Tuition and textbooks have nearly tripled in price since 1997:

How much more can students and their parents take?

3. Student loan debt is soaring. Earlier this year New York magazine put together this astonishing chart of the growth of student loan debt relative to other kinds of loans:
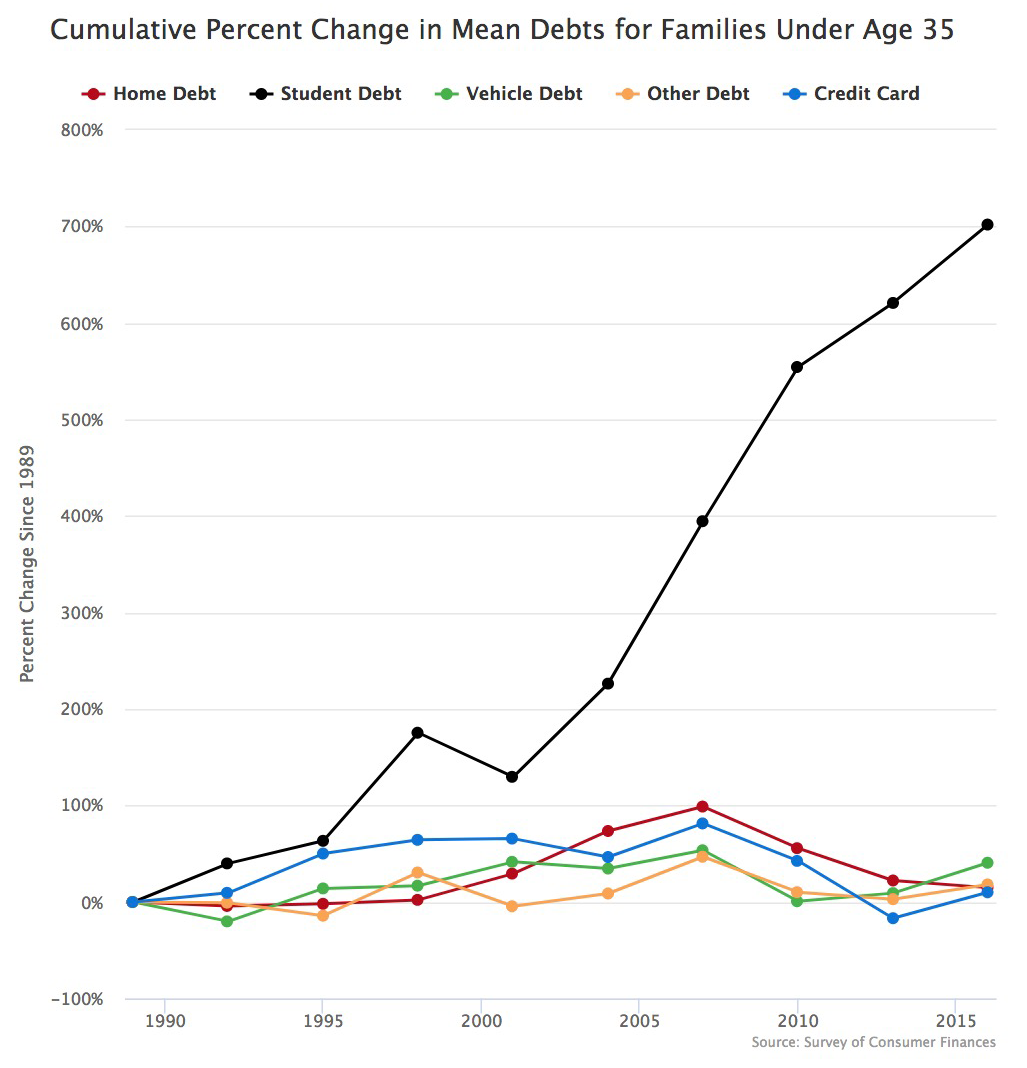
CNBC reports that:

Over the last decade, college-loan balances in the United States have jumped more than $833 billion to reach an all-time high of $1.4 trillion, according to a recent report by Experian.

The average outstanding balance is now $34,144, up 62 percent over the last 10 years. In addition, the percentage of borrowers who owe $50,000 or more has tripled over the same time period, according to a separate report by the Consumer Financial Protection Bureau.

The $1.4 trillion in student loans outstanding new exceeds total credit card debt and total auto loan debt. Some people now have over $1 million in student loan debt.

4. The over-education problem. One factor that’s seldom directly pointed out is the disconnect between the number of people who go to college, and the number who can plausibly cash in from a degree.

34.9% of people ages 25-34 have a bachelors degree or higher. This is probably a fair proxy for the share of younger people who will likely get degrees. But is 35% of the American public able to get a high paying job? Indicators are not.

Much as been made of income inequality, the decline of the middle class, etc. Some share of the population, probably 20% or less, is reaping disproportionate rewards in the modern economy. Others have seen stagnating real wages. For example, the Atlantic just ran a cover story talking about the “9.9%” that had this chart showing the share of wealth held by the 0.1%, the 9.9%, and the bottom 90%:

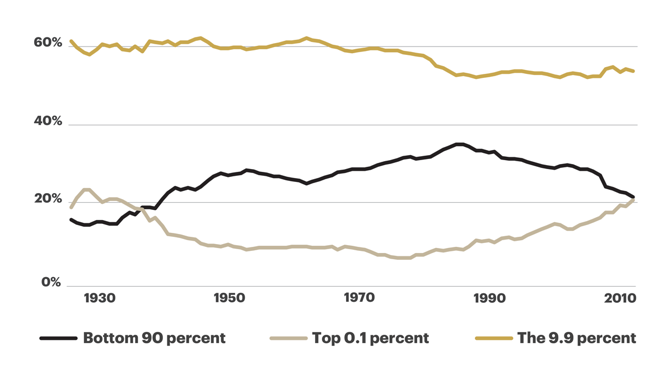
Even if people in the next decile below the 9.9% are doing well, that still leaves a ton of people with degrees who don’t necessarily face great economic prospects.

They might instead end up changing diapers at a DC day care center. Washington put forth a mandate that day care workers have a college degree, which indicates they must believe there will be no shortage of takers.

Combine a degree that won’t grant access to the high wage economy with student loan debt and it’s a recipe for big problems for young people.

This is an area that deserves more study.

5. University inequality. It’s not just workers who face inequality, but schools themselves. The Wall Street Journal has been reporting on a potential shakeout among colleges, in which the higher end universities continue to do well, but those ranked nearer to the bottom are in trouble. In one article related to this divergence they note:

For generations, a swelling population of college-age students, rising enrollment rates and generous student loans helped all schools, even mediocre ones, to flourish. Those days are ending. According to an analysis of 20 years of freshman-enrollment data at 1,040 of the 1,052 schools listed in The Wall Street Journal/Times Higher Education ranking, U.S. not-for-profit colleges and universities are segregating into winners and losers—with winners growing and expanding and losers seeing the first signs of a death spiral.

Similar they written that many non-selective small liberal arts may be in trouble.

6. MOOCs. The rise of online education, notably in the form of “massively open online courses” has yet to disrupt the higher education model, but with the factors above bearing down, there’s a huge financial incentive to make this work. Industry after industry have been radically restructured by technology innovation, and it’s reasonable to believe that the business model of higher education will one day end up on the receiving end.

7. The credentialing cartel. It’s widely understood that the primary value in a degree is having it. The degree itself is perceived as a key credential granting access to the job market. As Austen Allred put it, “Would you rather have a Princeton diploma without the Princeton education, or a Princeton education without a Princeton diploma?”

Universities are in effect a cartel who can levy an entrance toll to the professional job market. This may last for quite some time, or even strengthen, but there is again great value to be unlocked in breaking this cartel. The tech industry is a good example, where even famous companies have been founded by drop outs. If you are a great developer, it doesn’t matter what your credentials are. This has been one secret to that industry’s success.

None of these inevitably spells doom for colleges, and certainly not for any individual one. There is also a lot of nuance not captured in this short posting. But as a highlight of potentially disruptive forces, it shows that there is quite a collection of powerful disruptors and potential disrupters arrayed against the university environment. Savvy institutions should be working hard to get fit for the road ahead.

from Aaron M. Renn
http://www.urbanophile.com/2018/05/29/6-forces-disrupting-higher-education/

Do You Have to be “Into Minnesota”?

Lake Harriet in Winter by Amy Mingo. Licensed under CC BY 2.0

A friend of mine made an interesting observation about Denver, Boulder, and other cities in Colorado. He said, “The people who move to Colorado are really into Colorado.” By that he meant that they were extremely into the lifestyle there, notably outdoor endeavors. He mentions that it can be difficult to get people to show up for events in the city on weekends because people are out doing things. Those who aren’t as into the Colorado lifestyle either don’t come or don’t stay. In part, he surmises, because Colorado is not close to anything else.

Of course this isn’t a hard and fast rule. It’s just an observation of a characteristic that’s more common in Colorado than elsewhere.

I wonder if the same thing might be true when it comes to Minnesota recruitment. Minnesota has its own lifestyle going, which includes a lot of outdoor and winter sports. Minnesota also has its own unique local culture. And like Colorado, Minnesota is not particularly close to anything else.

So the question that comes to my mind is whether people really need to be “into Minnesota” at some level to be a good candidate for attraction. This is where something like “the North” branding can help. It can get people to understand what the Minneapolis and Minnesota lifestyle is such that those who might want it can find it and get drawn in.

from Aaron M. Renn
http://www.urbanophile.com/2018/05/25/do-you-have-to-be-into-minnesota/

Census Releases City Population Estimates

The Census Bureau just released its 2017 population estimates for municipalities. Here are the results for the 25 largest cities in American (as of 2017), ranked by year over year percentage change.

Rank Municipality 2016 2017 Total Change Pct Change
1 Seattle city, WA 707,255 724,745 17,490 2.47%
2 Fort Worth city, TX 855,504 874,168 18,664 2.18%
3 Charlotte city, NC 843,484 859,035 15,551 1.84%
4 Columbus city, OH 863,741 879,170 15,429 1.79%
5 San Antonio city, TX 1,487,738 1,511,946 24,208 1.63%
6 Phoenix city, AZ 1,602,042 1,626,078 24,036 1.50%
7 Dallas city, TX 1,322,140 1,341,075 18,935 1.43%
8 Denver city, CO 694,777 704,621 9,844 1.42%
9 Washington city, DC 684,336 693,972 9,636 1.41%
10 Austin city, TX 938,200 950,715 12,515 1.33%
11 Jacksonville city, FL 880,893 892,062 11,169 1.27%
12 Boston city, MA 678,430 685,094 6,664 0.98%
13 San Francisco city, CA 876,103 884,363 8,260 0.94%
14 San Diego city, CA 1,406,682 1,419,516 12,834 0.91%
15 Indianapolis city (balance), IN 857,453 863,002 5,549 0.65%
16 Los Angeles city, CA 3,981,116 3,999,759 18,643 0.47%
17 Nashville-Davidson metropolitan government (balance), TN 664,762 667,560 2,798 0.42%
18 El Paso city, TX 680,797 683,577 2,780 0.41%
19 Philadelphia city, PA 1,574,765 1,580,863 6,098 0.39%
20 Houston city, TX 2,304,482 2,312,717 8,235 0.36%
21 San Jose city, CA 1,031,942 1,035,317 3,375 0.33%
22 New York city, NY 8,615,426 8,622,698 7,272 0.08%
23 Chicago city, IL 2,720,275 2,716,450 -3,825 -0.14%
24 Memphis city, TN 653,369 652,236 -1,133 -0.17%
25 Detroit city, MI 675,480 673,104 -2,376 -0.35%

Seattle is killing it. I don’t believe the municipal boundaries have expanded, so this is real growth.

Dallas and Ft. Worth likewise did well, despite being landlocked. Nashville’s city population growth was surprisingly weak to me. It’s a very fast growing metro and has a city-county jurisdiction with plenty of opportunities for “internal sprawl” and a ton of apartments being built – yet surprisingly low population growth.

Detroit lost population again, but not that much.

Chicago is down in population again. However, this is only because the previous year’s data was adjusted upwards with its new release. I unfortunately deleted my previous vintage data set, but according to Wikipedia, Chicago’s 2016 population is 2,704,958. So had that base remained in effect, its population would have grown. Lyman Stone normally takes a look at annual data adjustments, so I’d expect him to have more to say on this.

Featured image credit: Rattlhed at Wikipedia – Public Domain

from Aaron M. Renn
http://www.urbanophile.com/2018/05/24/census-releases-city-population-estimates/

Ranking Larger College Towns

Photo Credit: ensign_beedrill CC BY-SA 2.0

A few weeks ago I took a look at smaller college towns. Today I’ll present some data about larger ones. This list is a bit more challenging in some respects. For one thing, because these are larger cities (relative to the previous list at a minimum), are they really “college towns”? Madison is the state capital of Wisconsin, for example. The university is important to be sure, but doesn’t dominate the city to quite the extent that say the University of Illinois does Champaign-Urbana. In any event, I’m presenting this with very limited analysis.

Population

Here’s my new list, sorted by total metro area population.

Rank Metro Area 2017
1 Knoxville, TN (University of Tennessee) 877,104
2 Madison, WI (University of Wisconsin) 654,230
3 Durham-Chapel Hill, NC (Duke, University of North Carolina) 567,428
4 Lexington-Fayette, KY (University of Kentucky) 512,650
5 Lansing-East Lansing, MI (Michigan State University) 477,656
6 Eugene, OR (University of Oregon) 374,748
7 Ann Arbor, MI (University of Michigan) 367,627
8 Lincoln, NE (University of Nebraska) 331,519
9 Boulder, CO (University of Colorado) 322,514
10 Gainesville, FL (University of Florida) 284,687

Knoxville is so big that I have my doubts as to whether it should be on the list. By contrast, in retrospect Gainesville may also have been a better fit for my previous list. (Also, I don’t claim this list is exhaustive. It’s just a sampling for blog purposes)

Here is where they rank on population change.

Rank Metro Area 2010 2017 Total Change Pct Change
1 Durham-Chapel Hill, NC 508,532 567,428 58,896 11.58%
2 Lincoln, NE 302,980 331,519 28,539 9.42%
3 Boulder, CO 295,930 322,514 26,584 8.98%
4 Lexington-Fayette, KY 473,306 512,650 39,344 8.31%
5 Madison, WI 606,578 654,230 47,652 7.86%
6 Gainesville, FL 264,607 284,687 20,080 7.59%
7 Eugene, OR 351,880 374,748 22,868 6.50%
8 Ann Arbor, MI 345,515 367,627 22,112 6.40%
9 Knoxville, TN 838,748 877,104 38,356 4.57%
10 Lansing-East Lansing, MI 464,189 477,656 13,467 2.90%

This is mostly in line with what I would have thought, though Lincoln is perhaps a bit higher up than most people would have guessed.

Gross Domestic Product

Here is a ranking by real GDP per capita.

Rank Metro Area 2016
1 Durham-Chapel Hill, NC 68,586
2 Boulder, CO 67,265
3 Madison, WI 64,767
4 Ann Arbor, MI 53,489
5 Lincoln, NE 51,013
6 Lexington-Fayette, KY 50,528
7 Lansing-East Lansing, MI 40,781
8 Knoxville, TN 40,548
9 Gainesville, FL 39,102
10 Eugene, OR 36,536

There is quite a dramatic disparity between communities on this metric.

Here they are ranked by change in real GDP since 2010.

Rank Metro Area 2010 2016 Total Change Pct Change
1 Madison, WI 59,248 64,767 5,519 9.32%
2 Eugene, OR 33,678 36,536 2,858 8.49%
3 Knoxville, TN 38,193 40,548 2,355 6.17%
4 Lexington-Fayette, KY 47,786 50,528 2,742 5.74%
5 Lincoln, NE 48,361 51,013 2,652 5.48%
6 Boulder, CO 64,097 67,265 3,168 4.94%
7 Lansing-East Lansing, MI 41,224 40,781 -443 -1.07%
8 Gainesville, FL 39,800 39,102 -698 -1.75%
9 Ann Arbor, MI 55,773 53,489 -2,284 -4.10%
10 Durham-Chapel Hill, NC 78,768 68,586 -10,182 -12.93%

It’s very interesting to see so many of these cities with declining per capita GDP, especially places conventionally touted as doing well such as Durham and Ann Arbor. The difference in performance between Madison and Ann Arbor (often bracketed together in comments about Midwestern cities) is notable.

Jobs

Again, we’ll start off by ranking by total jobs. Values in thousands.

Rank Metro Area 2017
1 Madison, WI 400.9
2 Knoxville, TN 395.8
3 Durham-Chapel Hill, NC 310.6
4 Lexington-Fayette, KY 278.4
5 Lansing-East Lansing, MI 235.1
6 Ann Arbor, MI 220.2
7 Boulder, CO 188.8
8 Lincoln, NE 188.3
9 Eugene, OR 159.0
10 Gainesville, FL 142.2

And next job growth since 2010.

Rank Metro Area 2010 2017 Total Change Pct Change
1 Boulder, CO 159.2 188.8 29.6 18.59%
2 Lexington-Fayette, KY 242.4 278.4 36.0 14.85%
3 Durham-Chapel Hill, NC 270.7 310.6 39.9 14.74%
4 Eugene, OR 141.4 159.0 17.6 12.45%
5 Gainesville, FL 126.7 142.2 15.5 12.23%
6 Ann Arbor, MI 196.3 220.2 23.9 12.18%
7 Madison, WI 359.4 400.9 41.5 11.55%
8 Knoxville, TN 358.2 395.8 37.6 10.50%
9 Lincoln, NE 172.2 188.3 16.1 9.35%
10 Lansing-East Lansing, MI 215.0 235.1 20.1 9.35%

My income database is slightly out of date, so I’m not going to include that figure for these communities.


from Aaron M. Renn
http://www.urbanophile.com/2018/05/23/ranking-larger-college-towns/

California’s Environmentalist-NIMBY Axis

Image via City Journal

California, which touts the most aggressive climate policies in the country, steadfastly refuses to do the one thing that would do the most for carbon emissions: permit new housing construction in green friendly areas. Instead, they pass policies like requiring solar panels on all new homes that simply jack the price of housing up even higher. This is the subject of my latest article over at City Journal. Here’s an excerpt:

The state’s rationale for imposing the solar directive is, of course, climate change. But as New York Times climate reporter Brad Plumer tweeted, adding 10,000 new apartments in San Francisco would reduce carbon-dioxide emissions in the state by three times as much as the solar-panel mandate because urban apartment-dwellers use less energy than single-home occupants. California is already a green-friendly state. Building more housing that lets more people live in California, even at current energy-efficiency levels, would have a positive effect on emissions. The alternative is forcing people to move out of state and into more polluting jurisdictions.

State legislators made an attempt to expand housing availability with Senate Bill 827, which would have preempted local zoning rules by requiring cities to allow midrise construction near rail stations and major bus stops. The legislation should have pleased climate-change activists by facilitating the construction of new transit-oriented development and increasing density. But powerful environmental groups in California, including the Sierra Club, lined up against the bill, which failed in committee.

Click through to read the whole thing.

from Aaron M. Renn
http://www.urbanophile.com/2018/05/22/californias-environmentalist-nimby-axis/

Rethinking Small Town Economic Development

A friend introduced me to downtown revitalization consultant David Milder, who sent me some of his thinking on economic development in small towns. I thought his idea for “small town entrepreneurship environments” was interesting, so I recorded a podcast with him on the subject. We talk about why many small towns can actually compete, why seeking to recruit manufacturing firms is likely a losing strategy, how to create an environment for “contingent entrepreneurs” the flourish, and quality of life improvement options.

You can download David’s white paper on STEEs here.

If the audio player doesn’t display for you, click over to listen on Soundcloud.

Subscribe to podcast via iTunes | Soundcloud.

Featured image photo credit: J. Stephen Conn, CC BY-NC 2.0

from Aaron M. Renn
http://www.urbanophile.com/2018/05/21/rethinking-small-town-economic-development/

The Big Ten’s National Footprint

Frequent commenter Frank the Tank, who is a guru about many aspects of universities and conferences, took the WSJ data I referenced two days ago and used it to create an extremely interesting analysis of the Big Ten. It’s highly recommended reading even if your interest is non-Big Ten schools.

Here Frank notes that the “big four” cities (as I’ve labeled them in other contexts) of NYC, DC, LA, and SF have a major Big Ten alumni presence:

There are only four markets in the entire country that drew more than 1% of the graduates from every single Big Ten school: New York, Los Angeles, Washington and San Francisco. None of these metro areas are located in the Midwest. Not even Chicago, the heart of the Big Ten, covered every single conference school, albeit the two sub-1% exceptions are the latest East Coast additions of Maryland and Rutgers.

To be sure, the Wall Street Journal notes that those four particular markets draw from a much wider range of colleges across the country. The sheer sizes of the New York and Los Angeles markets swallow up a lot of college grads and all four of the cities have strengths in industries that attract a national talent pool: finance in New York, entertainment in Los Angeles, tech in San Francisco, and government and politics in Washington.

The Big Ten’s top-to-bottom presence in those four markets is noteworthy because the only other Division I conference that has every member in those same markets is the Ivy League… and all of the Ivy League schools are in relatively close proximity to New York and Washington.

The Big Ten is the only conference with a truly national base of alumni, though the Ivy League is national where it counts:

The Wall Street Journal database shows that the Big Ten has the most nationalized alumni base of the Power Five conferences from top-to-bottom. As noted previously, the only other conference where every school has at least a Tier 3 connection with New York, Los Angeles, Washington and San Francisco is the Ivy League. More than half of the Big Ten has at least a Tier 3 connection with Atlanta, Boston, Dallas, Denver and Seattle. There are 4 or more Big Ten schools with a Tier 3 connection with Houston, Miami and Phoenix, too.

Within the Midwest, Chicago is the dominant destination. But other than Chicago, no other Midwest city has a Big Ten draw outside of their home state universities.

Putting aside Maryland and Rutgers, Chicago is still the market with the deepest ties to the Big Ten by a large margin. It is a Tier 1 market for 6 schools, Tier 2 market for 2 schools and Tier 3 market for 4 schools. No other metro area has more than 2 Tier 1 Big Ten school connections. This isn’t exactly surprising with the annual migratory pattern of new Big Ten grads taking over apartments in Lincoln Park and Lakeview every summer (while the older Big Ten grads like me move on to places like Naperville). Big Ten schools also send a lot of grads to the largest metro areas within their own home states. Every Big Ten school has a Tier 1 connection to at least one market located in its home state.

What’s stunning to me, though, is the utter lack of Big Ten grads going anywhere else in the Midwest other than Chicago or a metro area that has a presence in their school’s state. Detroit is the 2nd largest metro area in the Midwest, relatively easy driving distance from most of the Big Ten schools, and larger than both the Seattle and Denver markets. Yet, the only 2 Big Ten schools outside of Michigan and Michigan State that have even a Tier 3 connection to Detroit are Northwestern and Purdue. Meanwhile, 10 Big Ten schools have a Tier 3 connection with Denver and 8 of the league’s colleges have a Tier 3 connection with Seattle.

If Midwestern metros want to have any chance of changing their slow growth compared to the rest of the country, it’s clear that they need to do a better job of attracting the college grads that are just beyond their own home state universities. There really isn’t a great reason why Indianapolis isn’t drawing at least 1% of grads from neighboring state Big Ten schools like Illinois, Michigan, Michigan State and Ohio State… and Indy is one of the healthier Midwestern economies. Essentially, the Midwest metros with the exception of Chicago have completely ceded their “home field advantage” for Big Ten grads to the coasts and other high growth locations (e.g. Dallas, Atlanta and Denver).

It has been fascinating to go through the grad destination profiles of the Big Ten schools along with other colleges across the country. Once again, in matters more important than conference realignment, Midwestern cities in particular need to review this data and understand that they are giving up their home field advantage of nearby Big Ten grad talent to coastal cities that are providing such talent with more professional and economic opportunities. This is sobering data for every Midwest city outside of Chicago. They likely knew that this challenge was happening at some level, but the results are actually even worse than expected.

Chicago not only has a strong Big Ten presence, as Frank notes, “Interestingly enough, all of the Ivy League schools have at least a Tier 3 presence in Chicago, too.” It’s weaker than the big four coastal cities, but it’s there.

There’s a ton of other information in Frank’s post, including about the implications of expansion and analysis of future Big Ten conference moves. Click through to read the whole thing.

from Aaron M. Renn
http://www.urbanophile.com/2018/05/18/the-big-tens-national-footprint/

Chicago Parking Meter Lease Slow-Motion Train Wreck Only Has 65 More Years to Go

The Chicago parking meter lease is not just a bad deal that happened in the past. It’s an ongoing problem year after year. The Chicago Sun-Times just reported that the vendor’s annual revenues are now up to $134.2 million, meaning they will recoup the full amount they paid for the concession by 2021 – with 62 years left on the lease. The investors have already pocked $927 million. That doesn’t account for the time value of money, but even if you discount it back, this is looking like a good deal. (Just over the next decade, assuming revenues remain flat, that would equate to a discounted $384 million at a pretty high discount rate of 10%).

In more bad news, Emanuel had bragged that he’s significantly reduced the penalty payments that the city had to make to the vendor for closed parking spaces and the like. But that is now back up to $21.7 million per year.

In short, thecity:

  • Sold off rights to on-street parking revenues for 75 years for $1.1 billion, then promptly blew the money such as that residents have nothing to show for it.
  • Converted what used to be $23.8 million in annual revenues for the city and turned it into a $21.7 million expense – a $45.5 million per year swing in a city with serious financial problems.
  • Created barriers to repurposing on-street real estate for things other than parking, such as bus lanes, widened sidewalks, green space, etc.
  • Still has 65 more years to go


from Aaron M. Renn
http://www.urbanophile.com/2018/05/17/chicago-parking-meter-lease-slow-motion-train-wreck-only-has-65-more-years-to-go/

Where College Grads Are Moving

The Wall Street Journal just ran an interesting interactive feature where college grads move after graduation. They looked at 445 schools, and tracked destinations by metro area. They discovered that graduates, particularly from stronger schools, are flocking to major metro areas. The Big East, Ivy League, Pac-12, Big-12, ACC, and Big Ten are all over 70% in sending college grads to major metro areas (but see below for caveats).

The Ivy League grads are even more concentrated. A quarter of all Ivy League grads live in New York, Washington, or San Francisco. Here’s the WSJ map of cities where more than 2% of Harvard grads go.

Relative to population, Washington, San Francisco, and Boston punch well above their weight. Washington comes in #2 to NYC in the number of schools sending more than 2% of their grads there.

Alas, the Journal selected an unfortunate definition of major metro. They define them as the top 55 metro areas, plus the largest metro in the state, plus the largest metro in any state without one in the top 55, excluding Alaska. I don’t know anyone else slicing data this way. A more typical method would be to look at metro areas with more than a million people, of which there are 53. There are some clear midsized and lower tier cities below that on the Journal’s list, so the midsize city advocates are also going to claim this data for themselves. I can understand why they would want to include every state, but this definition of major metro raises questions about analysis based on it. I would like to see a re-slice, or better yet another field in their interactive tool to allow readers to set threshold sizes.

I’m also not quite sure what the graphs for schools mean. They are labeled as “Percentage of alumni in each metro area.” The top bucket is greater than 50%, yet some schools (e.g., Wisconsin) have multiple cities in that category.

College vs. College

I played around with comparing colleges, particularly within the same state. If we look at Michigan and Michigan State for example, we see U of M’s stronger east coast links.

Looking at Indiana vs. Purdue, we see that Purdue has a bigger national footprint.

City Draws

I’ve mentioned before that Indianapolis and Columbus draw migrants overwhelmingly from within their own states. The college draw maps confirm this.

In fairness, every region in the 1-2 million range I looked at was a regional draw. Here’s Nashville.

The city data look like follow some kind of gravity model based on size and distance, so many of the maps look vaguely the same with different origin points. Nevertheless, it’s fun to look at. Check it out.


from Aaron M. Renn
http://www.urbanophile.com/2018/05/16/where-college-grads-are-moving/